AY Automate / Original Research
What our own search data says about AI automation demand, this quarter.
Not a market-sizing report. Not a vendor panel. This is our own Google Search Console data and our own Ahrefs keyword research, published as a standing quarterly index. Every number below traces to one of those two sources, dated, and framed as our panel, not global truth.
153
Named queries analyzed
139K
Panel impressions, 28d
6.8%
Panel share of site total
98
Confirmed gap keywords
What this index is, and is not
Every SEO/GEO commentary piece cites the same handful of third-party panels for "what people are searching for AI automation." We have neither the reach nor the interest to compete with those panels on scale. What we do have is a real, dated, first-party dataset nobody else can reproduce: our own Search Console panel, and our own paid Ahrefs keyword research. This index fuses the two into one standing quarterly report.
It is not a claim about the AI-automation market broadly. It is a claim about what a real site with real rankings actually sees, and where the confirmed, sourced gap between that and the available search volume sits. Every figure below is labeled with its source and date.
What our search demand is actually about
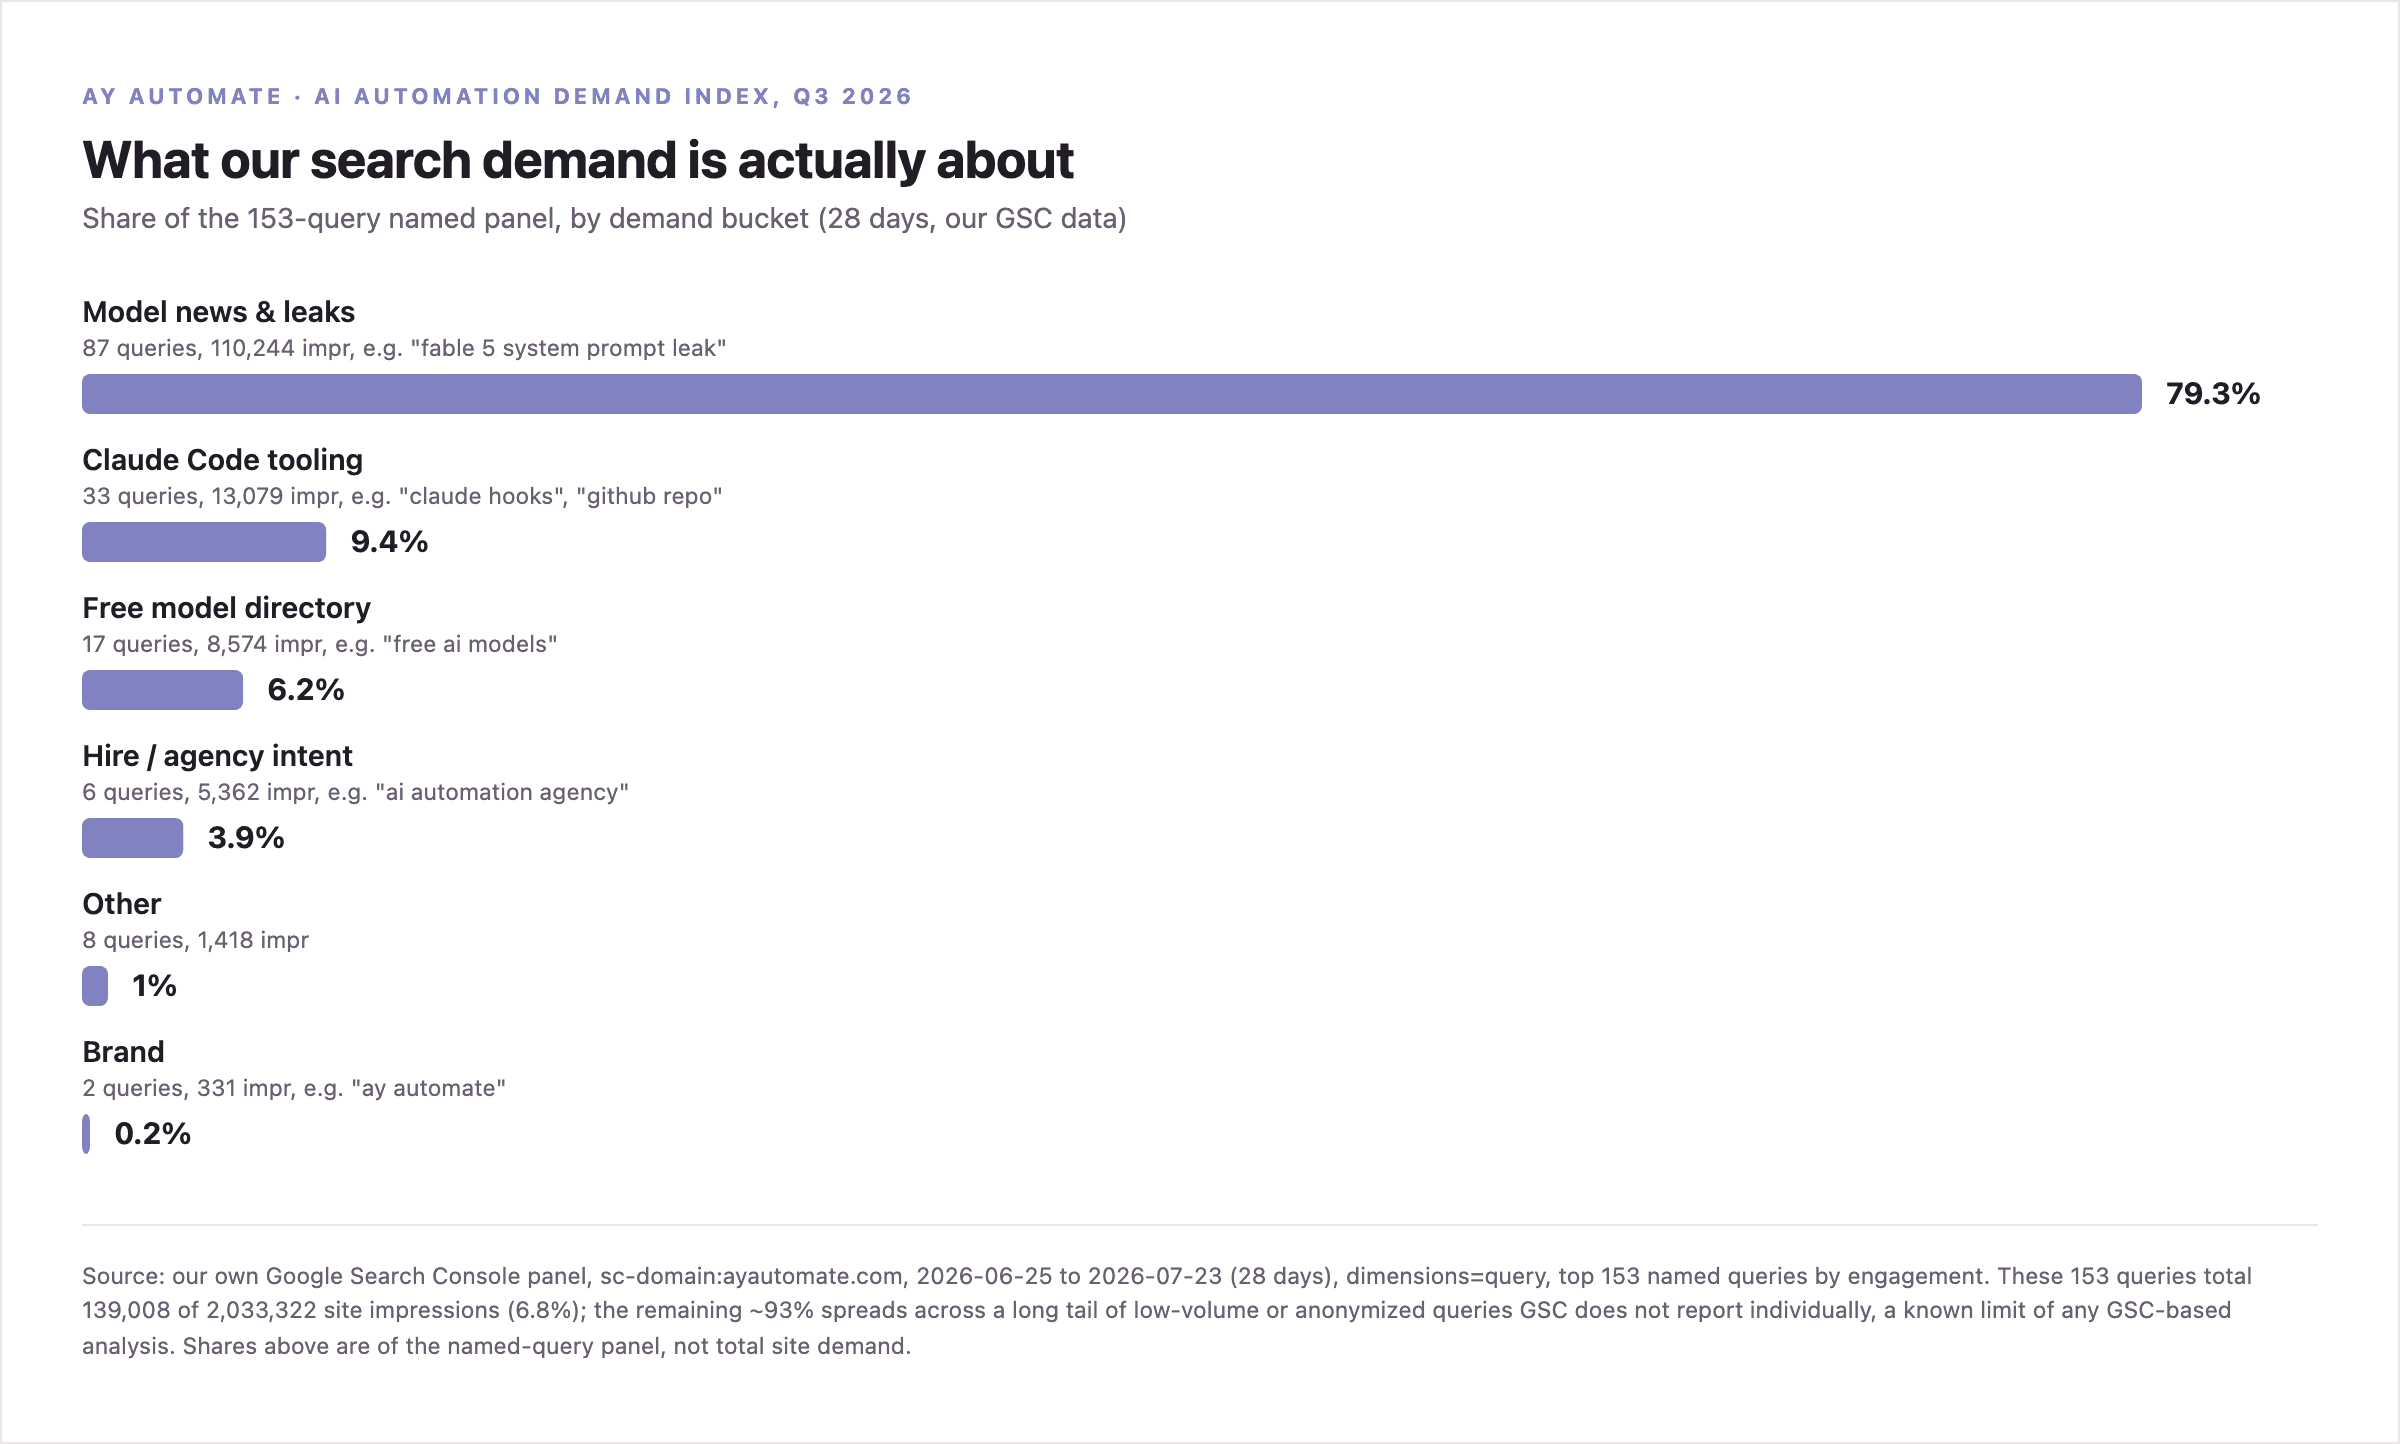
We pulled the 153 highest-engagement named queries in our 28-day panel and sorted each into a demand bucket by keyword pattern. Model-news curiosity traffic (a new model's pricing, a leaked system prompt, a benchmark comparison) dominates the named panel; buyer-intent traffic is a small fraction of it.
| Bucket | Share of panel | Detail |
|---|---|---|
| Model news & leaks | 79.3% | 87 queries, 110,244 impressions. Fable 5, Opus 4.8, Sakana Fugu, Mythos, system-prompt leaks, jailbreak content. |
| Claude Code tooling | 9.4% | 33 queries, 13,079 impressions. Hooks, GitHub repos, CLAUDE.md examples, templates, skills. |
| Free model directory | 6.2% | 17 queries, 8,574 impressions. "Free ai models", "free ai model api", open-source model lookups. |
| Hire / agency intent | 3.9% | 6 queries, 5,362 impressions. "Ai automation agency", ROI calculator, automation tooling. |
| Other | 1.0% | 8 queries, 1,418 impressions. Unclassified or mixed-intent terms. |
| Brand | 0.2% | 2 queries, 331 impressions. "Ay automate", "ayautomate". |
These 153 queries total 139,008 of 2,033,322 total site impressions (6.8%) in the same 28-day window. The remaining ~93% spreads across a long tail of low-volume or anonymized queries Search Console does not report individually, a known limit of any GSC-based analysis, not unique to this panel. Shares above are of the named-query panel, not of total site demand.
Confirmed content gaps, by cluster
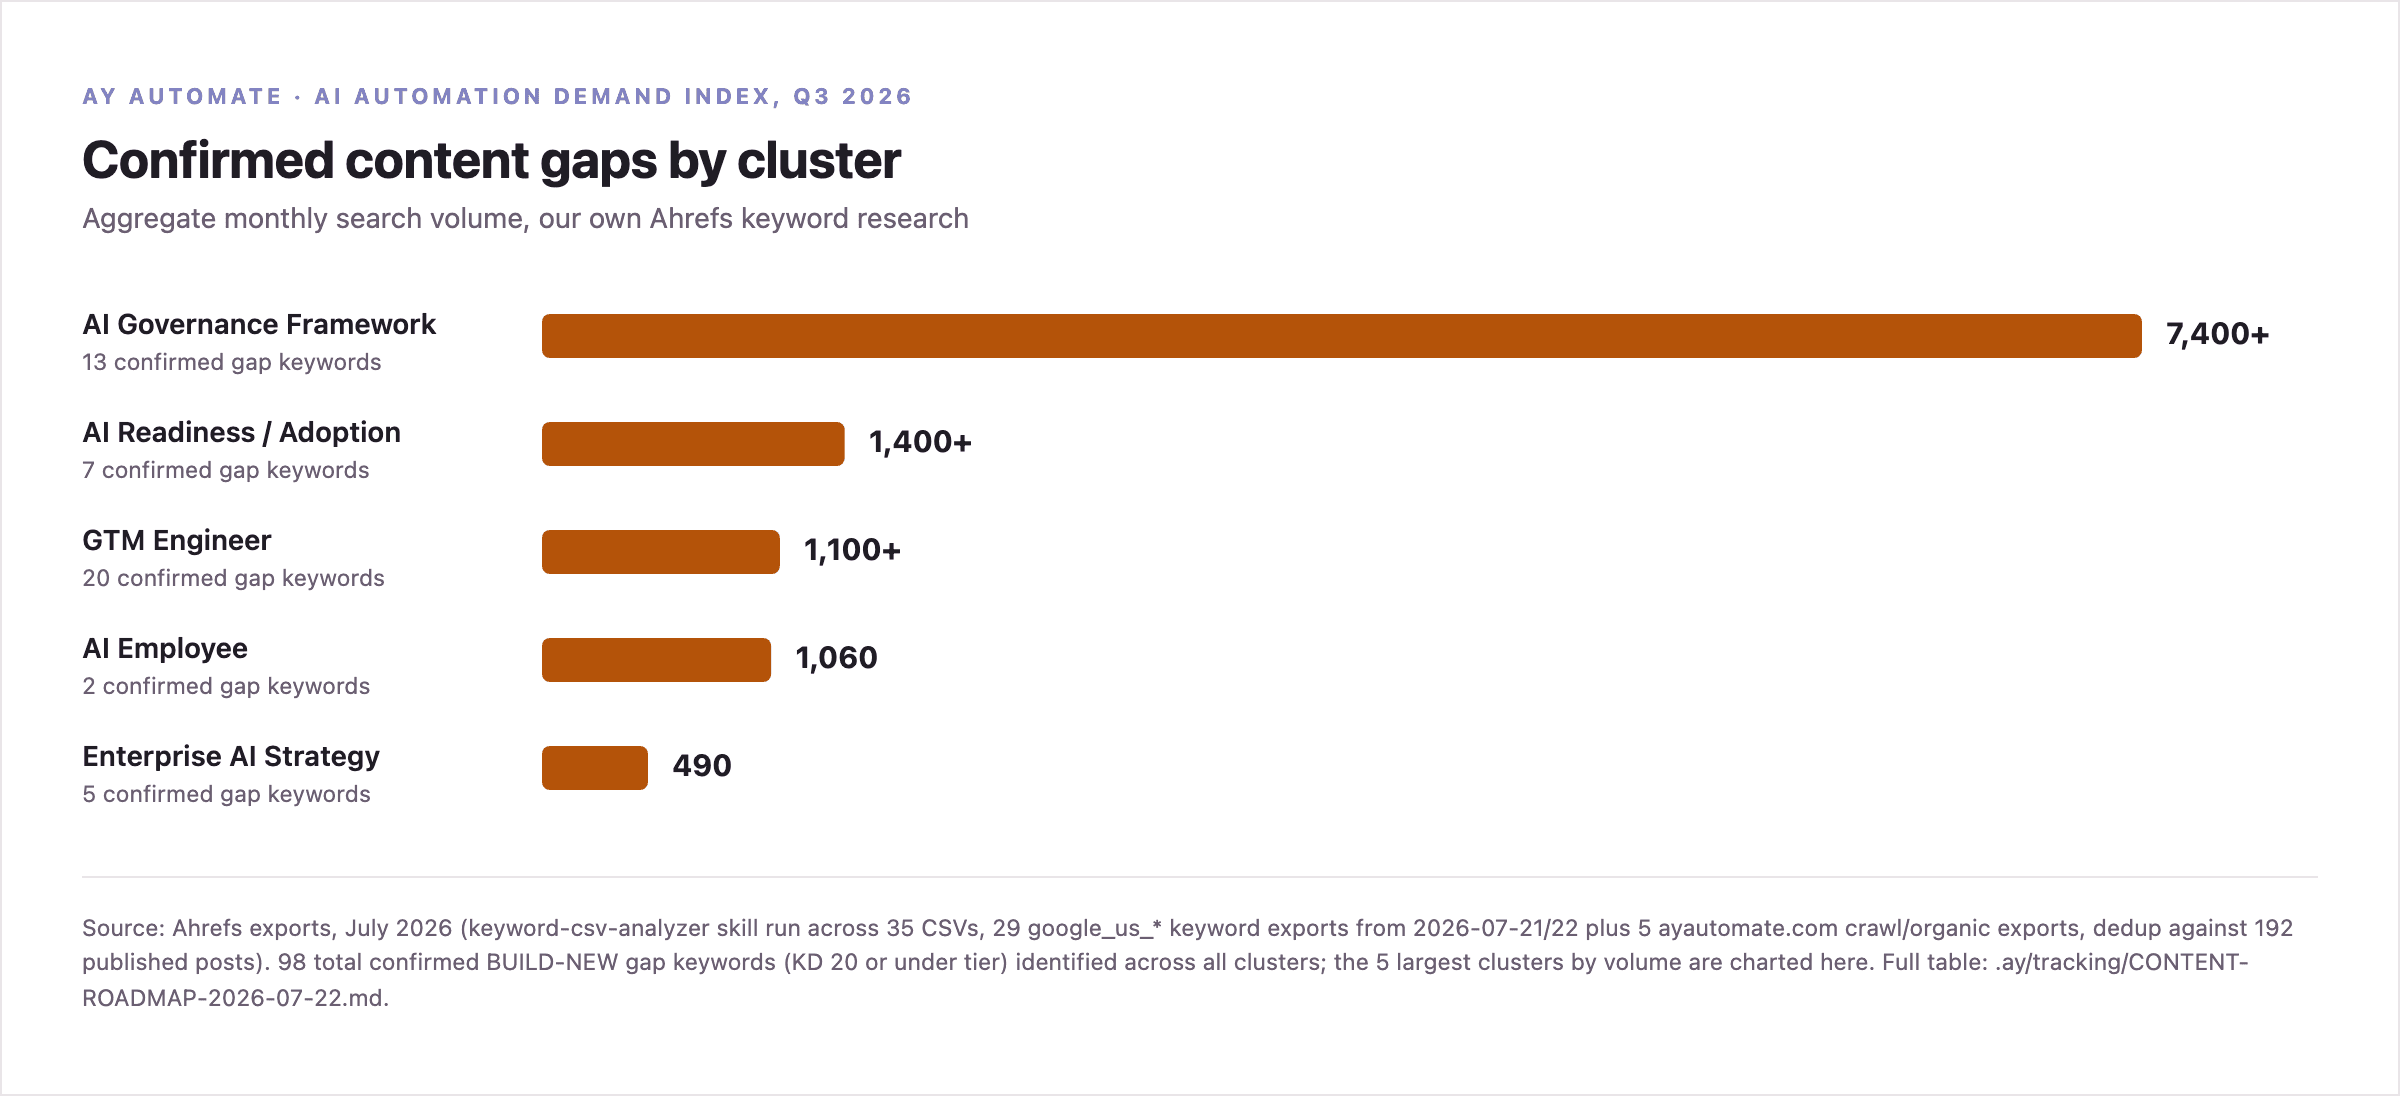
Separately from what we already rank for, our own Ahrefs keyword research confirms 98 gap keywords (KD 20 or under, no page currently targeting them) across five clusters. The five largest by aggregate monthly volume:
| Cluster | Volume | Gap keywords | Status |
|---|---|---|---|
| AI Governance Framework | 7,400+ | 13 | Live pillar, cluster still thin |
| AI Readiness / Adoption | 1,400+ | 7 | Live tool, cluster still thin |
| GTM Engineer | 1,100+ | 20 | Live pillar, cluster still thin |
| AI Employee | 1,060 | 2 | No page yet |
| Enterprise AI Strategy | 490 | 5 | Live service, cluster still thin |
Source: Ahrefs exports, July 2026, keyword-csv-analyzer skill run across 35 CSVs (29 google_us_* keyword exports from 2026-07-21/22, plus 5 ayautomate.com crawl/organic exports), deduplicated against 192 published posts. Full table: .ay/tracking/CONTENT-ROADMAP-2026-07-22.md.
What we see today vs where the gap sits
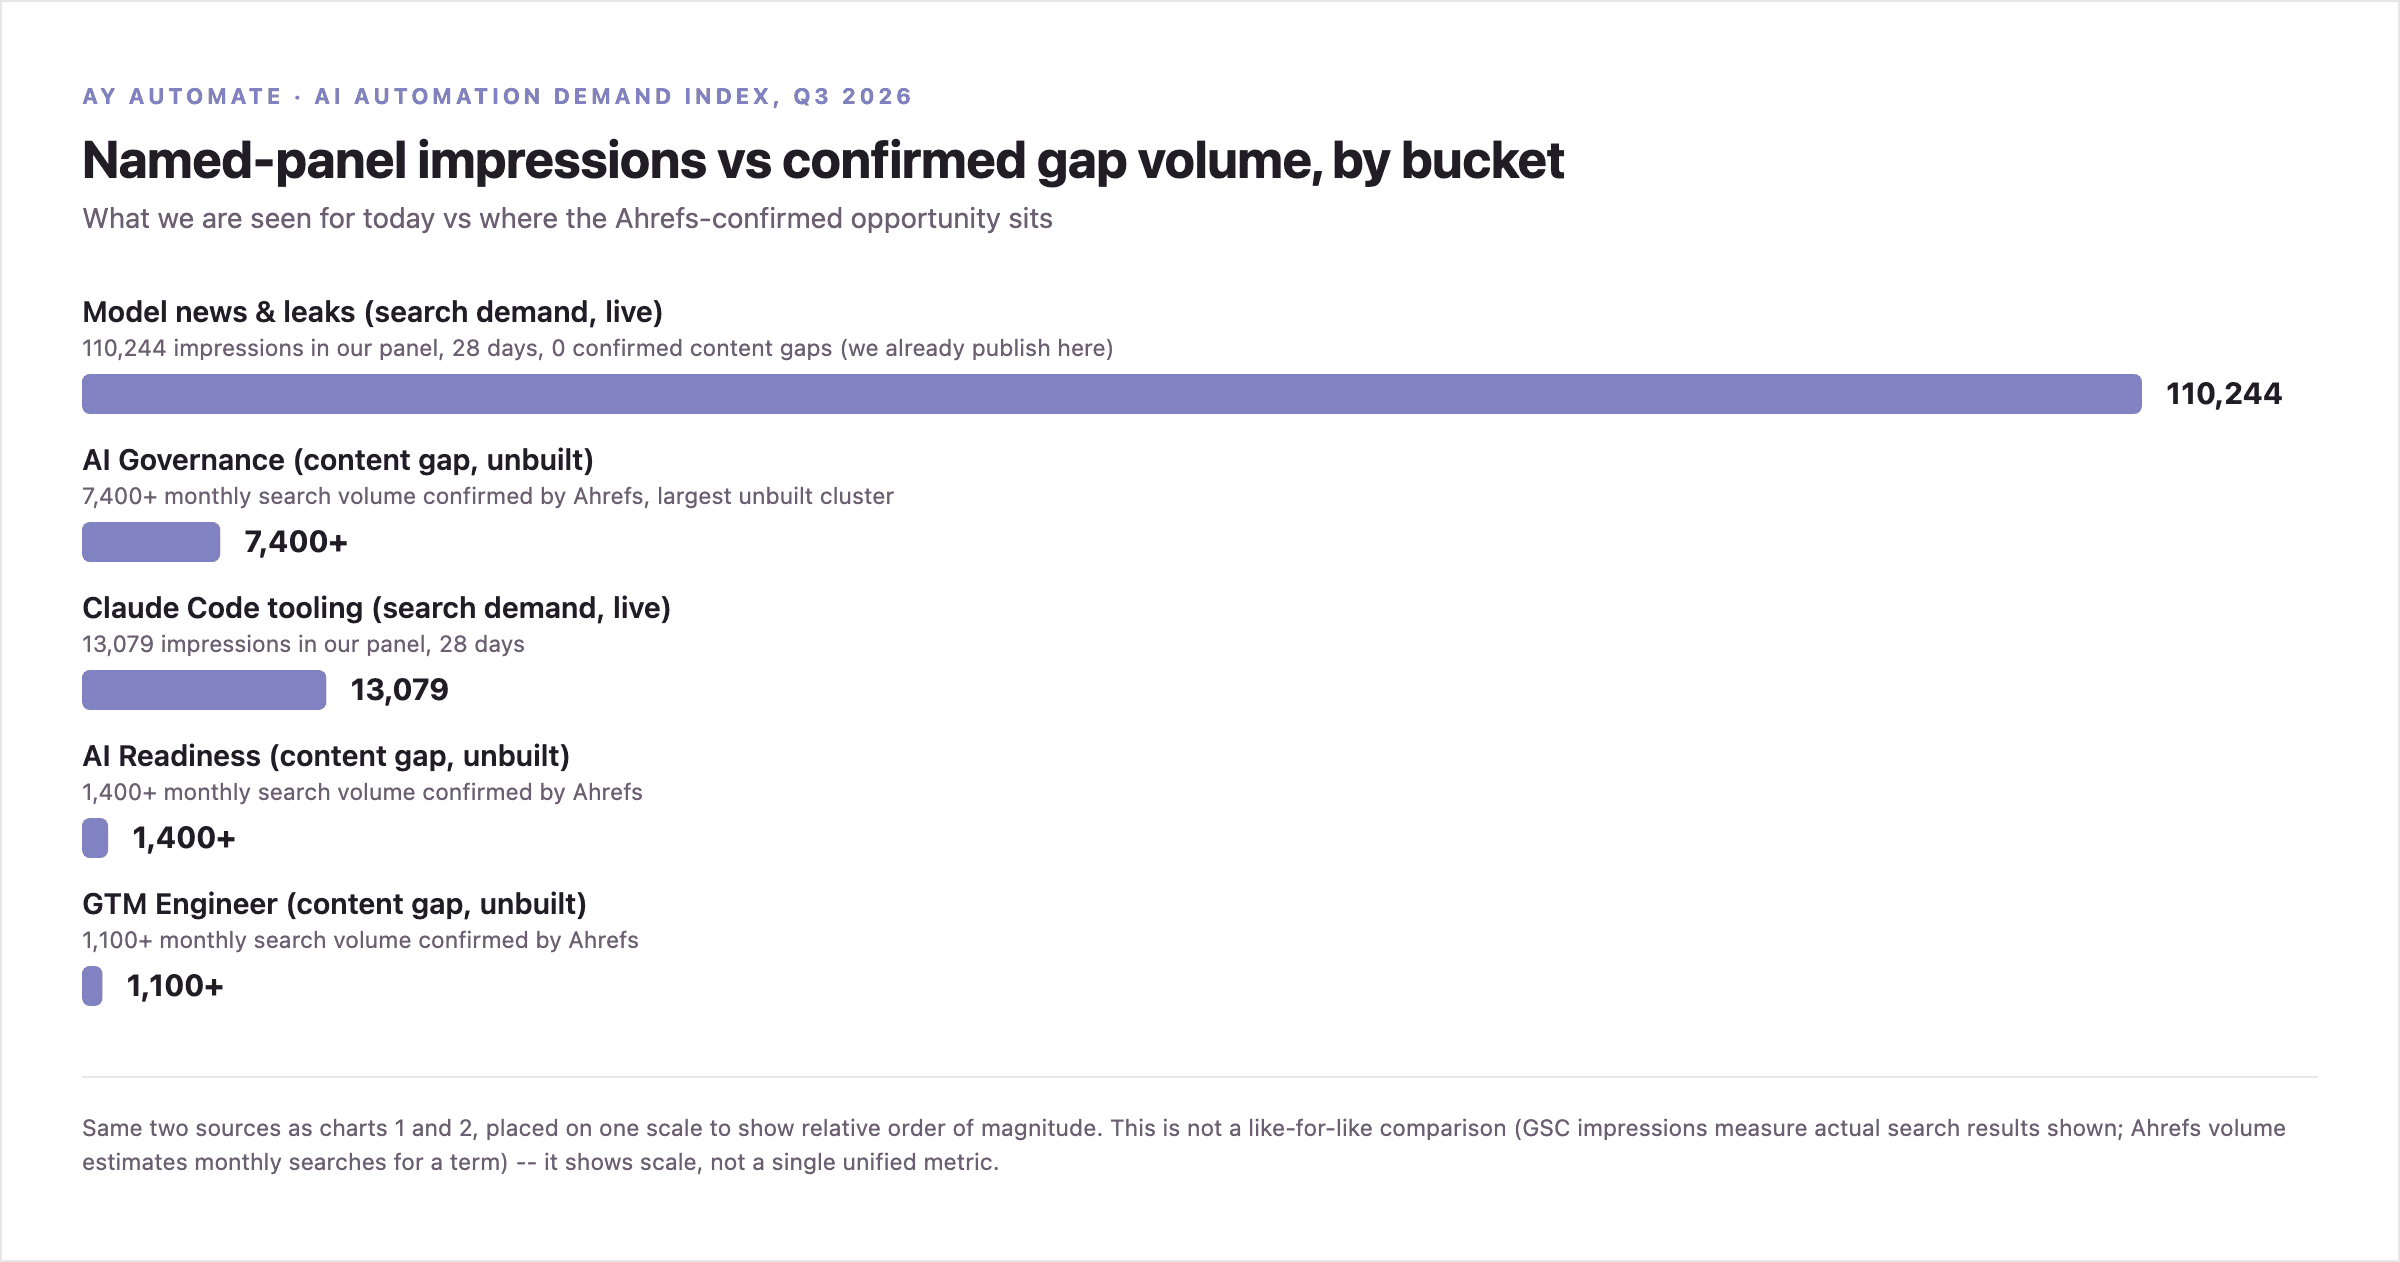
Placing live search demand and confirmed content-gap volume on one chart shows scale, not a single unified metric: GSC impressions measure actual search results shown to real people; Ahrefs volume estimates monthly search count for a term regardless of whether we rank. They are not directly comparable numbers, but the order of magnitude is the point.
Methodology, and the QoQ baseline
Demand-by-bucket data: mcp__gscServer__get_advanced_search_analytics, property sc-domain:ayautomate.com, dimensions=query, 2026-06-25 to 2026-07-23 (28 days), the 153 highest-engagement named queries returned. Each query was sorted into one bucket by keyword pattern match (a simple, disclosed classification, not an ML model): model/product names and leak/jailbreak terms to Model News; hooks, repos, templates, and CLAUDE.md terms to Claude Code Tooling; free-model-lookup phrasing to Free Model Directory; agency/automation/ROI terms to Hire/Agency Intent; brand terms to Brand; the remainder to Other.
Content-gap data: the keyword-csv-analyzer skill run across 35 Ahrefs CSV exports, deduplicated against 192 published posts by title token-overlap. A keyword counts as a confirmed gap only if it has KD 20 or under and no existing post or page targets it.
This is the first edition. There is no prior quarter to compare against, so every number on this page is the baseline itself, not a change figure. Starting with the Q4 2026 edition, this page will report real quarter-over-quarter change against these numbers rather than a fresh, disconnected snapshot. We are not backfilling or estimating a synthetic Q2 2026 baseline to manufacture an early trend line.
What this changes about our own roadmap
Two things follow directly from this edition. First, the CTR gap on our highest-impression model-news pages is worth more than new content, since that bucket already carries 79.3% of our named-panel visibility: we are actively rewriting titles and descriptions on those pages rather than starting new ones. Second, the AI Governance cluster is the single largest confirmed, sourced gap on the site at 7,400+ monthly search volume against a pillar page that already exists but is not yet backed by a full supporting cluster, making it the clearest next investment this index points to.
Our AI governance framework guide and GTM engineer pillar are the two live pages this index is grounded in. If your own team needs this same read, our own panel plus our own methodology, applied to your search visibility, our fractional CAIO practice runs that analysis as part of an AI strategy engagement.
Frequently asked questions
What is the AI Automation Demand Index?
It is our own quarterly read on AI-automation search demand, built from two first-party sources: our own Google Search Console panel (what people actually search that leads them to ayautomate.com) and our own Ahrefs keyword research (confirmed search volume for terms we do not yet rank for). It is not a global market-sizing report and does not claim to represent demand beyond our own panel.
Where does the data come from?
The demand-by-bucket chart comes from a live pull of sc-domain:ayautomate.com in Google Search Console, dimensions=query, 2026-06-25 to 2026-07-23 (28 days), the top 153 named queries by engagement. The content-gap chart comes from a keyword-csv-analyzer run across 35 Ahrefs CSV exports (29 google_us_* keyword exports from 2026-07-21/22 plus 5 ayautomate.com crawl/organic exports), documented in .ay/tracking/CONTENT-ROADMAP-2026-07-22.md.
Why is this the first edition, not a quarter-over-quarter report?
Because this is genuinely the first time we have pulled and published this panel. Quarter-over-quarter change requires a prior quarter to compare against, which does not exist yet. This edition is the baseline; the next edition, Q4 2026, will report real QoQ change against the numbers on this page.
Does model-news traffic at 79.3% mean AI automation demand is mostly hype?
It means that share, specifically, of our own named-query panel, which itself is only 6.8% of our total site impressions (the rest is a long tail of low-volume or anonymized queries Search Console does not report individually). It says more about which content currently ranks on this site than about the AI-automation market broadly. Buyer/hire-intent queries are a real but much smaller share of what we are currently visible for, which is exactly the gap the content-gap chart is built to size.
Refreshed every quarter
Q4 2026 will report real change against this baseline, on this same page.
No new URL each quarter. The series stays comparable, and every past edition's numbers stay attached to the same anchor links.