AY Automate / Original Research
The Forward Deployed Engineer Salary Report, 2026.
We have been burned by unsourced "FDE salary" content before, so this report holds itself to one rule: every number is triangulated across 2 or more named sources, or presented as someone else's attributed claim. No invented percentile spreads. No single-endpoint average asserted as a fact.
$150K
Median base (H1B, n=21)
$211K
Median total comp (Levels.fyi)
$177K
Median total pay (Glassdoor, n=429)
4
Named sources triangulated
Executive summary
Three credible, named sources report three different numbers for Forward Deployed Engineer compensation at Palantir, the role's originator and the only company with enough public data to triangulate: a $150,000 base-salary median from legally filed H1B disclosure (n=21), a $211,000 total-compensation median from Levels.fyi (self-reported), and a $177,381 total-pay median from Glassdoor (self-reported, n=429). None of these numbers is wrong. They measure different things.
Location moves the Glassdoor average from $154,686 (New York City) to $190,706 (Washington, DC). Seniority moves it further, though we do not have a separately sourced figure per level, only our own disclosed partition of the national H1B range. Widely cited round numbers like "$150K to $1M" trace to a single named source (Varick Agents) making its own claim, not an independently audited fact, and we present it as exactly that below.
Comp by source, US national
Three sources, three different measurements of the same role. Reading them as competing claims about one number is the mistake; reading them as three real measurements of three different things is the honest way in.
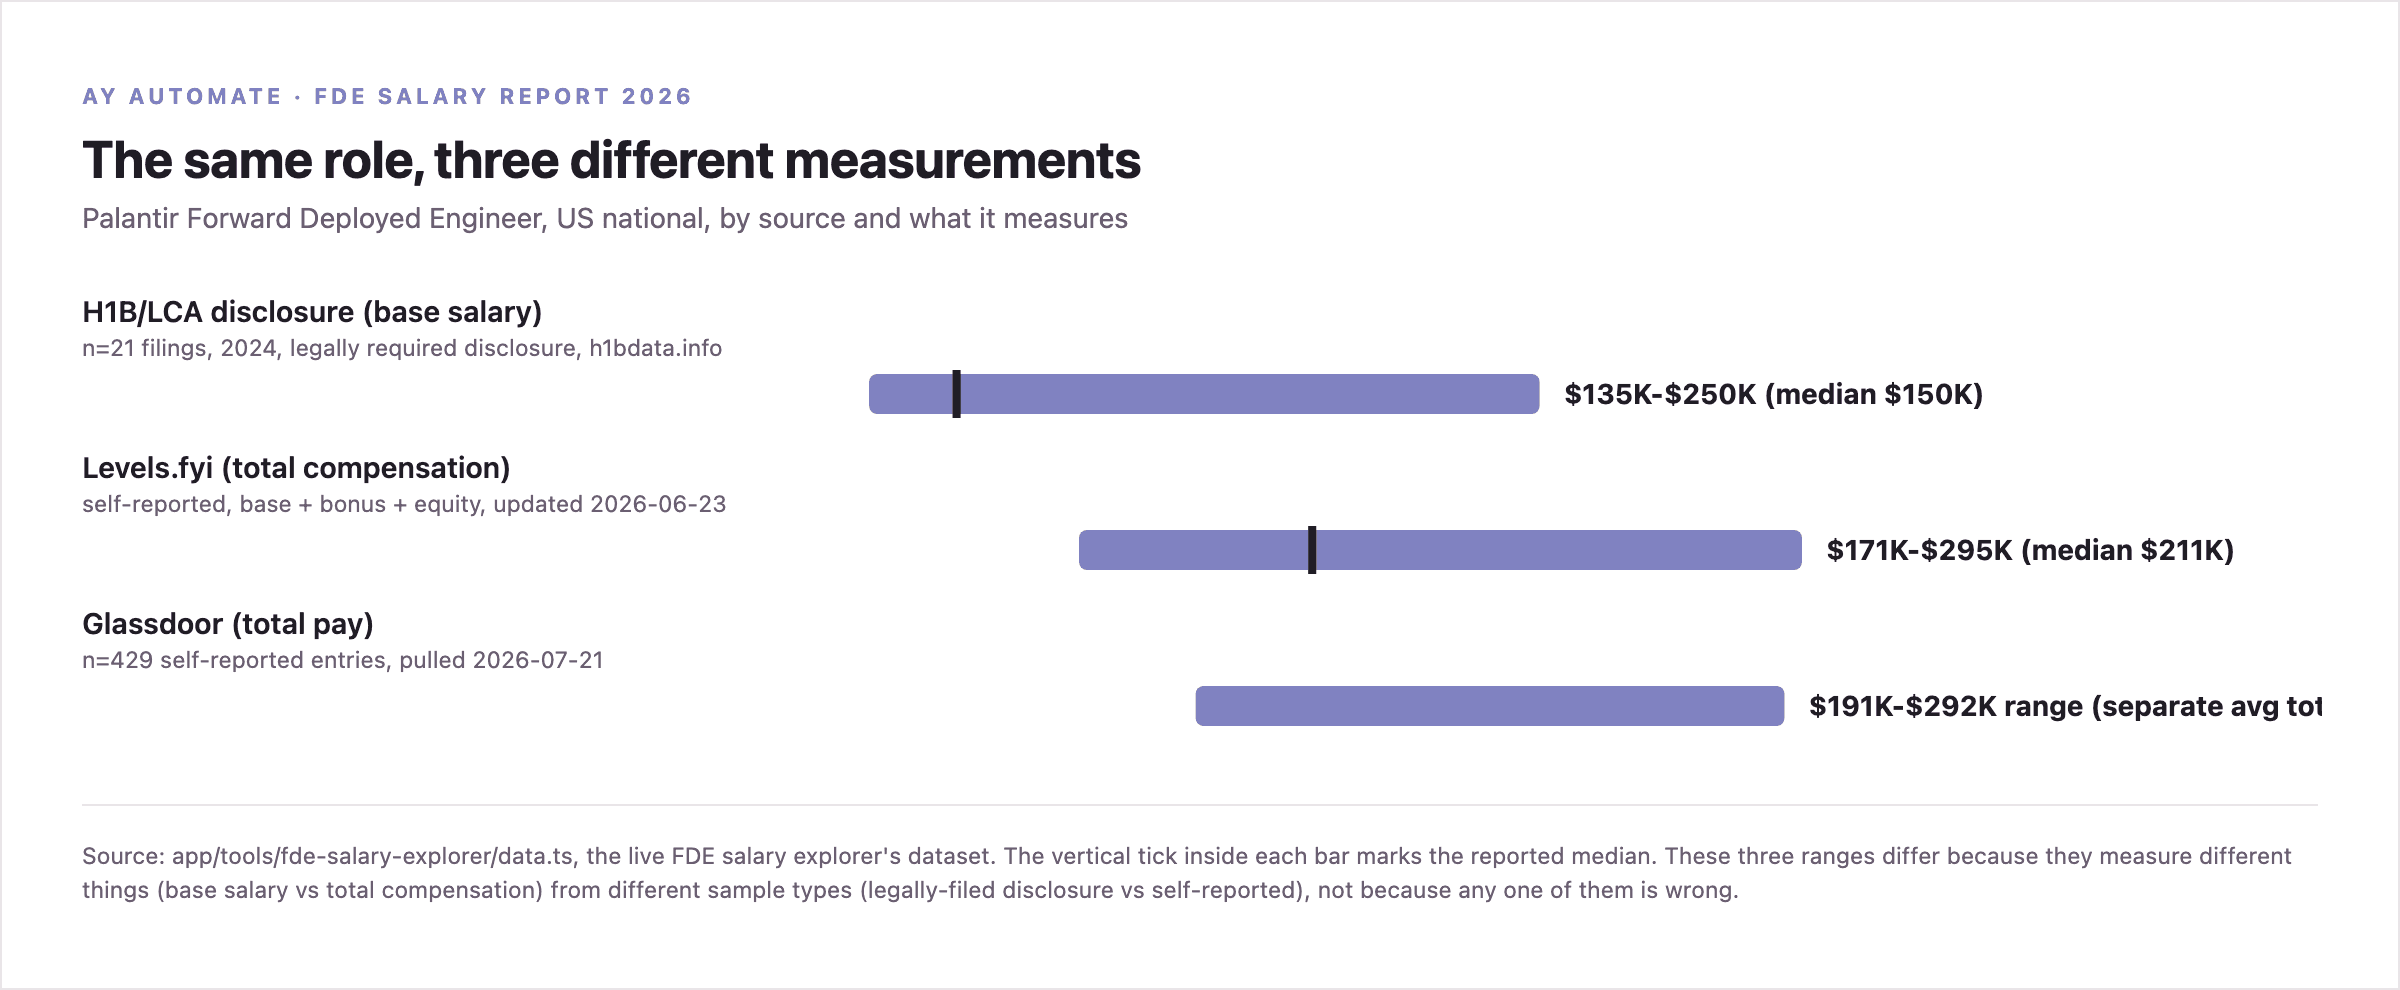
| Source | Measures | Range | Median | Sample |
|---|---|---|---|---|
| H1B/LCA disclosure (h1bdata.info) | Base salary | $135,000 - $250,000 | $150,000 | 21 filings, 2024 |
| Levels.fyi | Total compensation (base + bonus + equity) | $171,000 - $295,000 | $211,000 | self-reported, updated 2026-06-23 |
| Glassdoor | Total pay | $191,000 - $292,000 | $177,381 (avg) | 429 self-reported entries, pulled 2026-07-21 |
H1B/LCA disclosure (h1bdata.info): Legally required disclosure for H1B-sponsored hires. Real filed data, not self-reported, but covers only base salary and only H1B-sponsored roles.
Levels.fyi: Directional, not audited. Self-reported data tends to skew toward people motivated enough to submit a figure.
Glassdoor: Largest sample size of the three. This total-pay range is Glassdoor's own estimate, separate from its base-pay-only 25th-75th percentile band of $124,513 to $198,096. The $177,381 figure is Glassdoor's separately published average total pay, which sits below this range's low end because it blends a wider set of levels/locations than the range calculation.
Comp by location
Glassdoor publishes a single average figure per location rather than a range for most of these, so the numbers below are point averages, not distributions.
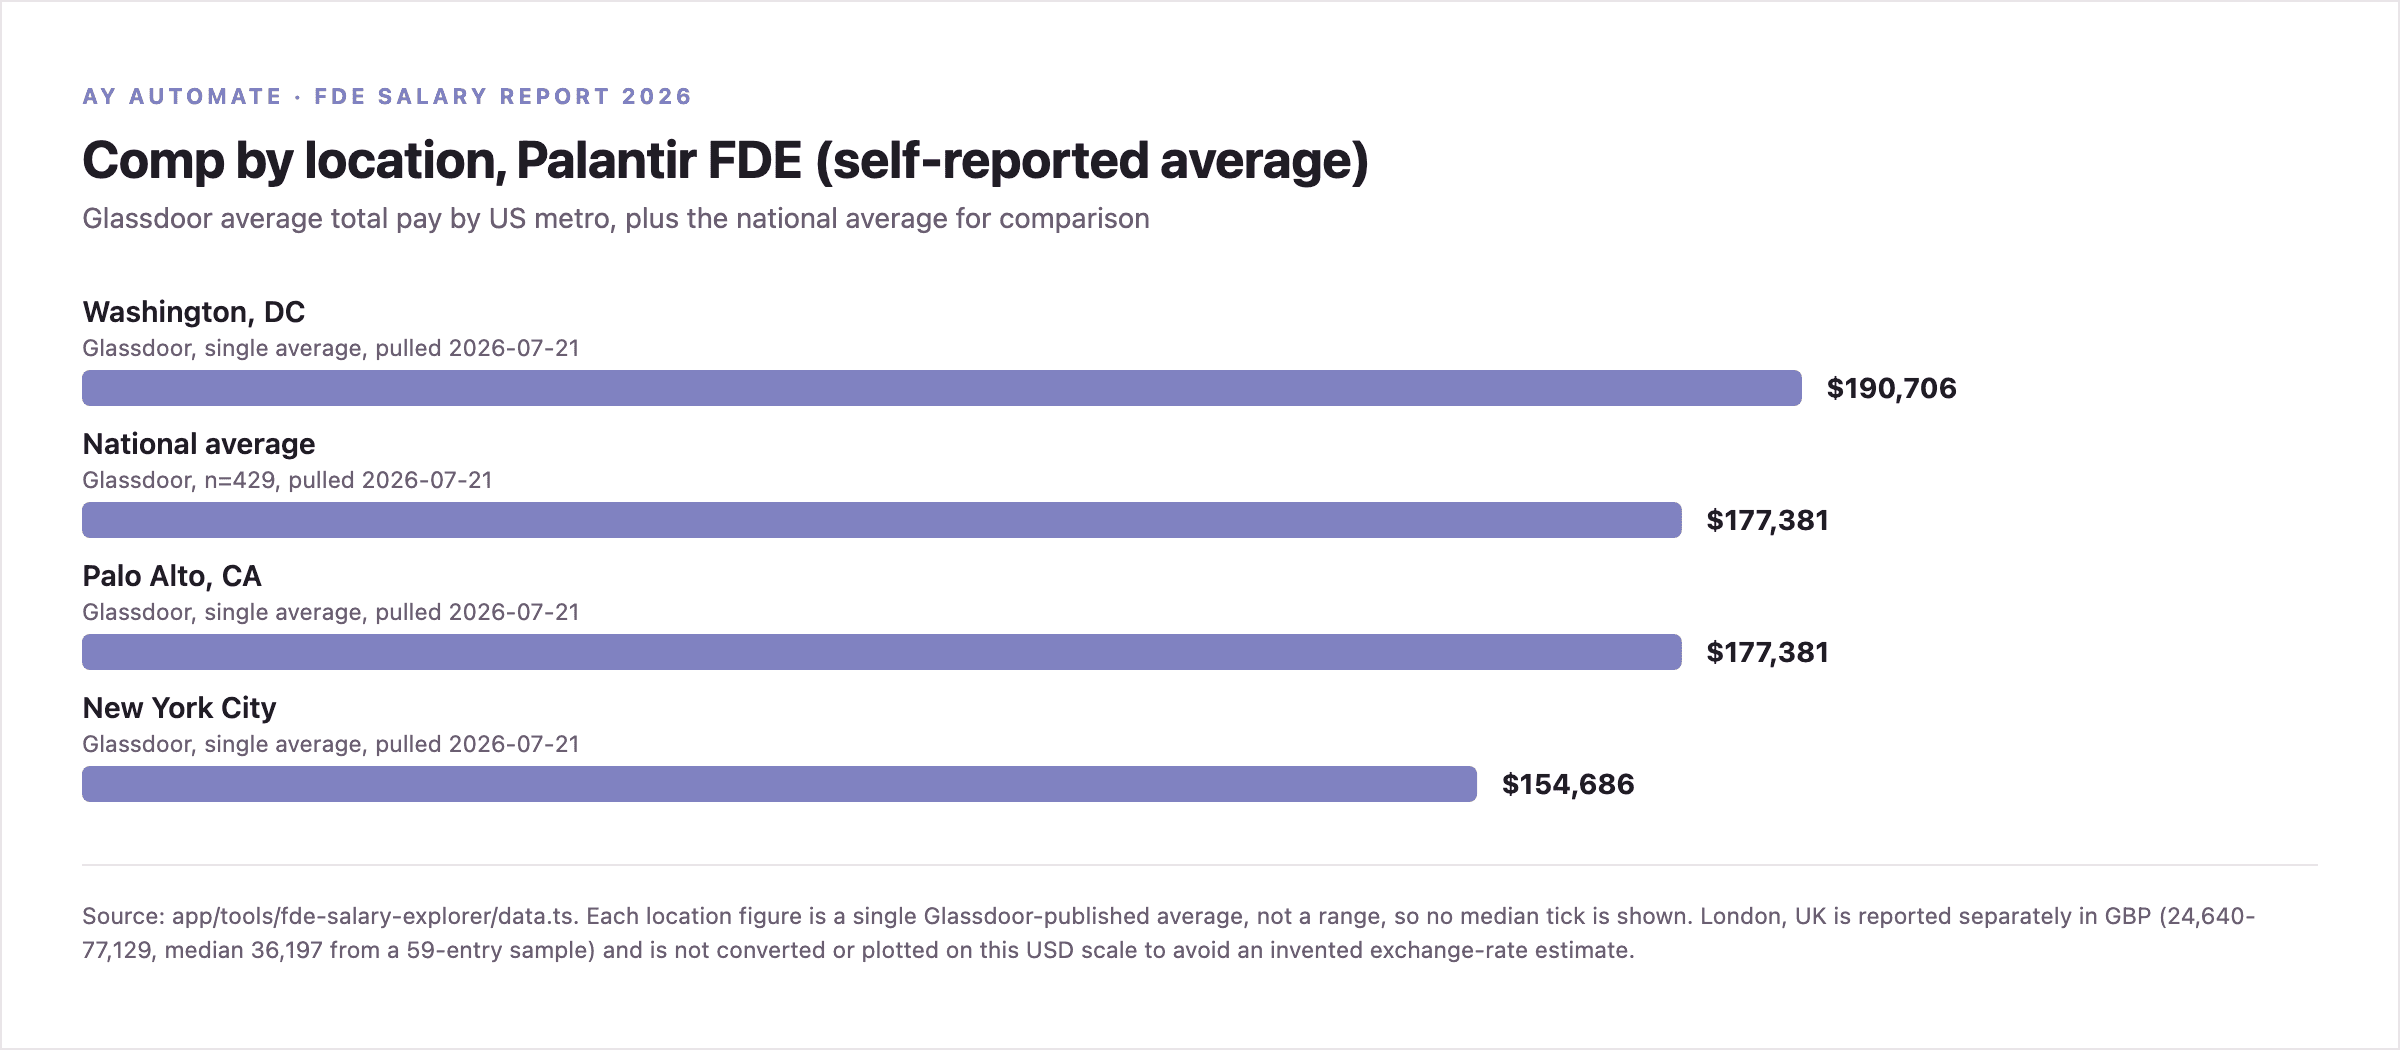
| Location | Figure | Type |
|---|---|---|
| Washington, DC | $190,706 | Average total pay |
| National average | $177,381 | Average total pay, n=429 |
| Palo Alto, CA | $177,381 | Average total pay |
| New York City | $154,686 | Average total pay |
| London, UK | £24,640 - £77,129 (median £36,197) | Average total pay, n=59 |
The London figure looks low for the role and comes from a small sample (59 entries). We are showing it exactly as Glassdoor publishes it, not smoothing it, because an oddly low outlier from a real source is more honest than a plausible-looking number we made up. Verify against a live London posting before relying on it.
Comp by seniority
We do not have a separately sourced compensation figure per experience band. What we show here is our own partition of the sourced national H1B range ($135,000 to $250,000, n=21) by percentile position, on the honest assumption that more experienced hires sit toward the top of a real, cited range. This is a reasoned estimate applied to real data, not a new, independently verified data point, and our salary explorer tool states this every time it renders a result.
0-2 years (entry)
Lower 0-30th percentile of the national H1B range
2-5 years (mid)
25th-60th percentile of the national H1B range
5-10 years (senior)
50th-85th percentile of the national H1B range
10+ years (staff/lead)
75th-100th percentile of the national H1B range
FDE vs adjacent roles
Only figures already verified and published on our own live pages, no new research for this comparison.
| Role | Figure | Source |
|---|---|---|
| Forward Deployed Engineer (Palantir, national) | $135,000 - $250,000 base (median $150,000) | H1B/LCA disclosure, n=21, 2024 |
| GTM Engineer (US) | $100,000 - $330,000+ total comp (median $132,000) | Levels.fyi, as of July 2026, per our GTM Engineer pillar |
| GTM Engineer (US, alternate figure) | ~$187,000/yr average | Glassdoor search-page average, unverified by direct page load, per our GTM Engineer pillar |
| AY Automate placement (not a salary) | From $60,000/year | AY Automate's own live starting price, nearshore rate |
The AY Automate placement price is what a company pays for an embedded engineer, not a salary paid to an individual, so it is not directly comparable to the rows above it. See the GTM Engineer pillar for the full GTM Engineer comp breakdown and its own sourcing caveats.
Methodology, and what we left out
Every figure on this page comes from app/tools/fde-salary-explorer/data.ts, the same dataset that powers our live FDE salary explorer, sourced from four places: H1B/LCA disclosure data (h1bdata.info, 21 filings for the exact job title "Forward Deployed Engineer," 2024), Levels.fyi (self-reported), Glassdoor (6 separate location pulls, 2026-07-21), and AY Automate's own published pricing.
We deliberately left three things out rather than guess: India (Glassdoor shows a small, 12-entry sample with currency formatting we could not verify against a second source), Singapore (no aggregator returned a usable sample for this exact job title), and OpenAI, Anthropic, or other frontier labs beyond Palantir (none appear to have a separately aggregated "Forward Deployed Engineer" compensation entry distinct from general Software Engineer titles as of this writing).
We also cite, without asserting, Varick Agents' widely referenced $150,000 to $1,000,000 range from their FDE-in-30-Days guide. It is the most detailed public breakdown of the role's methodology we have found, but the compensation figure itself is their stated claim, not independently audited data, and we are not repeating any of the unsourced, oddly-precise figures that a wave of newly published low-authority sites publish with no visible methodology.
Frequently asked questions
What is the real median salary for a forward deployed engineer?
There is no single verified, audited median we would assert as fact. The three sources we triangulate report different medians because they measure different things: H1B/LCA disclosure reports a $150,000 base-salary median (legally filed, n=21), Levels.fyi reports a $211,000 total-compensation median (self-reported), and Glassdoor reports a $177,381 total-pay median (self-reported, n=429). All three are real, cited, and correct for what they measure.
Why do the three sources disagree so much?
Mostly because they measure different things from different sample types. H1B/LCA data is legally filed base salary for H1B-sponsored hires only. Levels.fyi and Glassdoor are self-reported total compensation (or total pay) across a broader, unverified sample. Comparing a base-salary median to a total-compensation median as if they were the same number is the single most common error in FDE salary content online.
Is the $150K-$1M range some sites cite accurate?
That range comes from Varick Agents' FDE-in-30-Days guide, and it is their stated claim, not independently audited data and not a number we assert ourselves. We cite it because it is a named, linkable source, not because we have verified it against payroll records. See our forward deployed engineer salary guide for the full context on that figure.
Does experience level change FDE compensation?
Almost certainly, but we do not have a separately sourced figure per experience band. What we show on this page is our own partition of the sourced national H1B range (n=21) into four experience bands by percentile position, clearly labeled as our estimate, not a separately verified per-level figure. Treat it as a reasoned partition of real data, not a new data point.
Where does this report get its numbers, and what did you leave out?
Every figure traces to one of four sources: H1B/LCA disclosure data (h1bdata.info), Levels.fyi, Glassdoor (6 separate pulls by location), and AY Automate's own published pricing. We deliberately excluded India (unclear currency formatting we could not verify against a second source), Singapore (no usable aggregator sample), and frontier labs beyond Palantir like OpenAI or Anthropic (no separately aggregated FDE-title compensation data exists for them yet). Full detail in the methodology section below.
We place forward deployed engineers, we do not set market salaries
Filter these ranges by region and experience with the interactive explorer.
Or if you are ready to place an embedded engineer, our own pricing is published, not quoted only after a sales call.